Dig into the 5 Whys using AI-curated clusters of underlying causes—facilitating root-level problem solving, not just symptoms.
The Fishbone Diagram, or Ishikawa Diagram, is one of GooValid’s most effective tools for uncovering the root causes behind innovation challenges. What makes it unique inside GooValid is that it doesn’t start from scratch—it leverages insights already gathered from the first eight toolkits. Stakeholder Maps reveal who is involved, Market and Environmental Analyses highlight external pressures, Observations and Exploratory Interviews expose real user behaviors, while Empathy Maps, Persona Analyses, and Jobs-to-Be-Done Canvases clarify user motivations and needs. All of this rich input flows directly into the branches of the Fishbone, ensuring that every cause you analyze is grounded in validated evidence, not assumptions.
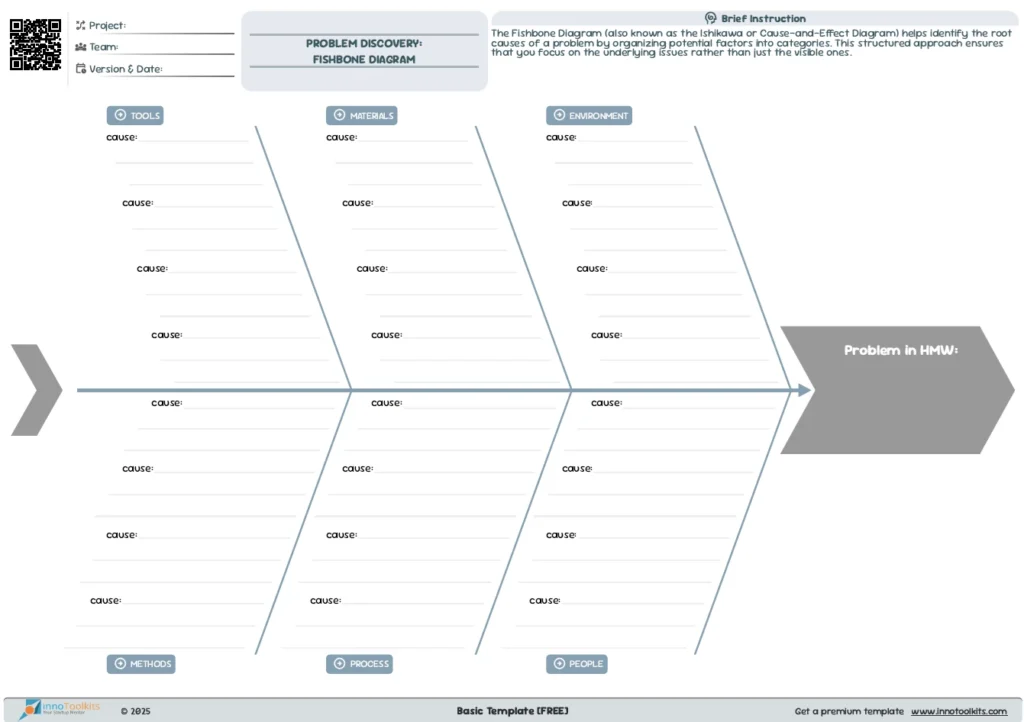
With AI support, GooValid automatically organizes these insights into categories like People, Process, Tools, Materials, and Environment. It suggests potential contributing factors and highlights patterns that other innovators in similar industries have faced. By combining structured inputs with intelligent automation, the Fishbone Diagram helps entrepreneurs and corporate innovators move beyond surface symptoms and identify the true root causes of their challenges—so they can focus resources on solving what really matters.